Stop combing through text files and start visualizing your SFTP traffic with Grafana, Loki, and Alloy.
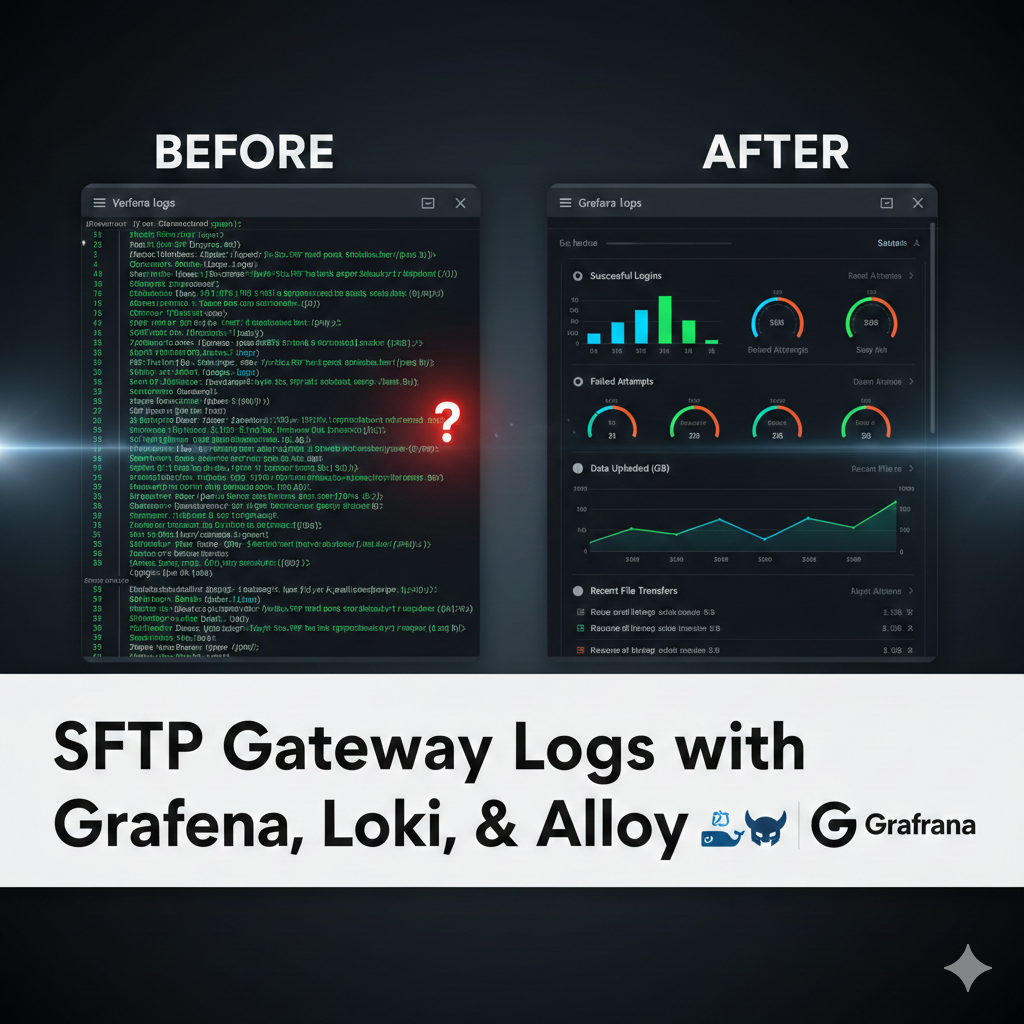
If you are responsible for secure file transfers, you know that audit logs are a goldmine of information. But let’s be honest: when an auditor asks for a report on 3:00 AM login failures or a manager wants to know who uploaded a massive 50GB file, nobody wants to be grep-ing through thousands of lines of raw text.
In our latest tutorial, we show you how to transform those messy audit logs into a professional, real-time observability dashboard using a single Docker command.
The “Why” Behind Log Observability
Most SFTP Gateway users are familiar with CloudWatch metrics like CPU and Disk I/O. While those are great for server health, they don’t tell you the human story of your data.
By deploying an observability stack (often called the LGTM stack: Loki, Grafana, and Alloy), you move from reactive troubleshooting to proactive security. You get instant visibility into:
- Authentication Success vs. Failure: Spot brute-force attacks in seconds.
- Transfer Volume: See which users are moving the most data.
- Audit History: Filter by username or filename to see exactly where a file went.
Watch the Full Tutorial
In this 11-minute deep dive, we walk you through the entire deployment process on Docker Desktop.
What’s Inside the Stack?
Think of your SFTP audit log like a social media feed. Each log entry is a “post,” with a timestamp, an IP address, a filename, and a transfer status. Searching raw logs for a specific event is like trying to find every mention of something on a social media platform. Technically possible, practically miserable.
The observability stack solves this by tagging each entry (much like hashtags) so you can filter instantly. Here’s how the three components work together:
- Alloy: The collector. It watches your SFTP Gateway audit logs as entries come in and does something smart: instead of just storing the raw text, it extracts key data points and turns them into structured labels — filename=file.txt, IP=1.2.3.4, date=2/20/2026 — while compressing the full log line into a tiny indexed file. Think of it as auto-tagging every post the moment it’s published.
- Loki: The log database. Instead of storing rows of plain text, Loki organizes everything by those labels. When you need to find every transfer from a suspicious IP, Loki doesn’t scan thousands of lines — it just looks up the tag and unzips exactly what you need.
- Grafana: The visual layer. This is where it all comes together. Pre-built dashboards give you an instant view of your SFTP traffic, and the “Explore” tool lets you run custom LogQL queries — the equivalent of searching “show me everything tagged #1.2.3.4.”
Get Started with One Command
We believe that infrastructure should be easy to test. That’s why we’ve bundled this entire stack into a single docker-compose.yaml file. You can spin up SFTP Gateway along with the entire monitoring suite in minutes.
Note: This setup is perfect for local testing on macOS or Windows using Docker Desktop. For production deployments on EC2 or Azure VMs, check our specific cloud documentation.
Resources & Documentation
Ready to deploy? Everything you need is available in our Knowledge Base:
- 📖 Full KB Article: Docker Log Observability Guide
- 📂 Config Files: Access the Alloy, Loki, and Grafana configuration templates directly from the article.
Have questions about setting up your dashboard? Join the conversation in the comments of the video or reach out to our support team.
Next: Learn how to deploy SFTP Gateway from Thorn Technologies as a Docker Container.